

The majority of professionals in the B2B space opt for visually appealing dashboards over other mediums.
Among other visual components such as charts, graphs, maps, and other elements, color forms the most powerful aspect that can significantly influence the visual appeal, user experience, and comprehension of the presented data.
Leveraging Colors to Craft Compelling Dashboard Designs
As data-driven storytellers, we would like to share some of the best practices for wielding this powerful tool to convey insights.
Color Palette Matters: Choosing a set of colors that reflect the brand values, ethos, and identity, fosters a cohesive visual representation across the dashboard design, making it more intuitive to navigate.
Color Psychology At Play: Colors have inherent meanings and can stir emotions. For instance, red often signifies negative values like low sales or high disease rates, while green represents positive values like high sales or low disease rates. Understanding these associations allows for a more strategic approach while selecting colors and effectively communicating the intended message.
Color Code: Certain colors emphasize specific data, while others represent less significant information. Blue and purple highlight specific categories or information, while grey can effectively convey information or tasks lower on the priority scale.
Striking the Right Balance of Saturation and Hues: Crafting a harmonious, meaningful design for the users involves balancing the color components: Hues and Saturation. While overly saturated color helps draw the user’s attention to the crucial elements, using too many colors in a design that is hyper-saturated can negatively affect the visual appeal.
Focus on Accessibility: The impact of color stretches far beyond aesthetics and emotions. Inclusivity should also be a key focus when it comes to color choices. Users who are visually impaired or are diagnosed with color blindness require high-contrast colors and additional visual cues. Additionally, providing the option to seamlessly switch between light and dark modes caters to the needs and preferences of different users.
Colors in the Context Of Data Representation: A Deep Dive
Illustrating with an example.
The Problem Statement: Identifying the product category at a specific retail store that yields the highest sales.
Data: We have a retail dataset of sales transactions that unravel key insights into customer purchasing behavior, their choice of products, preferred payment methods, and more.
Delving into the specifics: Distribution of Product Categories
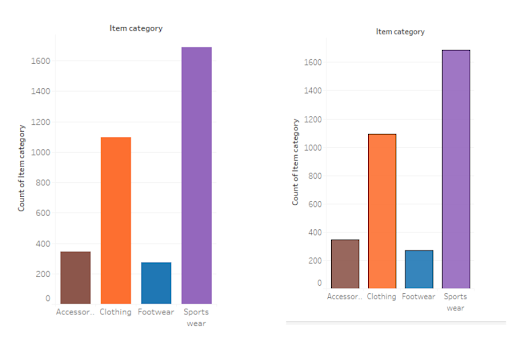
High-Intensity Colors Low-Intensity Colors
Drawing from the insights provided by the bar graphs, it is evident that the sportswear category generates the highest sales compared to other categories.
While this chart is visually appealing, we wanted to explore using a single color and incorporating the parameter—the number of products purchased for each category—to highlight the segment with the highest sales.
The result
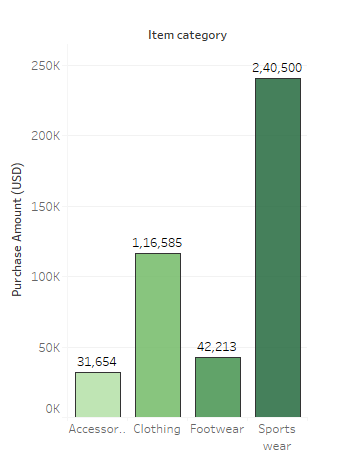
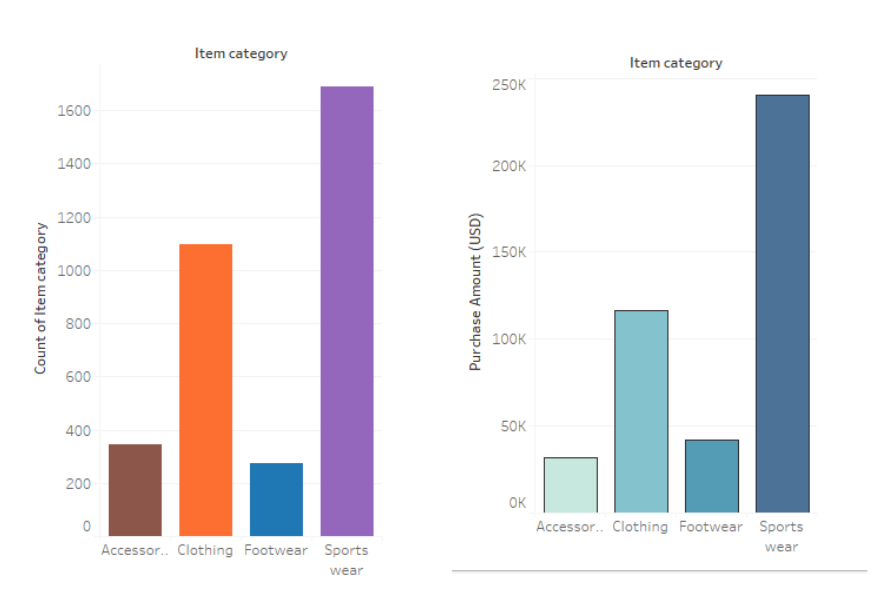
While opting for a single color can enhance clarity, green often signifies positive attributes and could convey the wrong message. Instead, we used blue and simplified the graph further by removing the number from above each bar to enhance the appearance.
The outcome
A clean and straightforward layout makes it easier for the users to comprehend the results.
A Closer Look At Inclusive Design
Accessibility has grown to become an essential aspect of design. Nearly 8% of men and 0.5% of women are affected by color vision deficiency (CVD). People with CVD cannot distinguish specific colors, for example, red-green color blindness. Hence, being aware of the colors, combinations, and shapes that appeal to these individuals becomes crucial.
Additionally, incorporating shapes and icons alongside color can enhance the visual appeal, making it easier to read. For instance, bubble charts, where the size of the bubble conveys information, can be beneficial. However, this concept does not apply to all aspects. Caution should be exercised with heatmaps, as they heavily depend on colors and might not be suitable.
Colors transcend mere visual elements. They wield the power to communicate and influence users’ decisions and perceptions. Strategic use of color, with a focus on accessibility and the various needs of the target audience, brings about clarity and easy-to-digest data, ensuring that users can swiftly and efficiently find what they are looking for, thus creating dashboards that cater to individuals globally.


