

Technologies such as generative AI (GenAI), large language models (LLMs), and automation are transforming the data analysis landscape. As data becomes increasingly central to these innovations, our engagement with it evolves rapidly.
To stay competitive and enhance customer relationships, businesses must embrace data-driven decision-making.
To illustrate this further, let us explore two different scenarios.
Scenario 1:
Imagine you are a marketing manager of a well-renowned company. Your job involves monitoring campaign performance, customer engagement, and campaign effectiveness metrics. Traditionally, you would have to:
- Log into the company’s main dashboard: This dashboard contains all the data for every department.
- Navigate through multiple pages: You find and filter the specific data relevant to marketing.
- Manually update the filters: Ensure the data is current and reflects the most recent activities.
This process can be time-consuming and frustrating, especially when you have to repeat it daily. It results in users spending too much time sifting through irrelevant data, leading to inefficiencies and missed opportunities.
Scenario 2:
Imagine starting your day with a customized snapshot of your business’s most essential data trends delivered to your device. Instead of wading through endless reports or left to decipher complex dashboards, you get the key insights you need precisely when you need them right off the bat.
Introducing Tableau Pulse: Your Gateway to Data Empowerment
 .
.
Tableau Pulse is an AI-driven analytics feature within Tableau that focuses on making data more accessible and actionable for users. It leverages machine learning and natural language processing to deliver insights and alerts directly to users, often through personalized notifications.
But what makes Tableau Pulse stand out, and how can it reshape your data strategy? Let’s explore this innovative tool and discover how it can turn data into your most valuable asset.
Unlocking Power of Tableau Pulse: Features for Enhanced Data Analytics
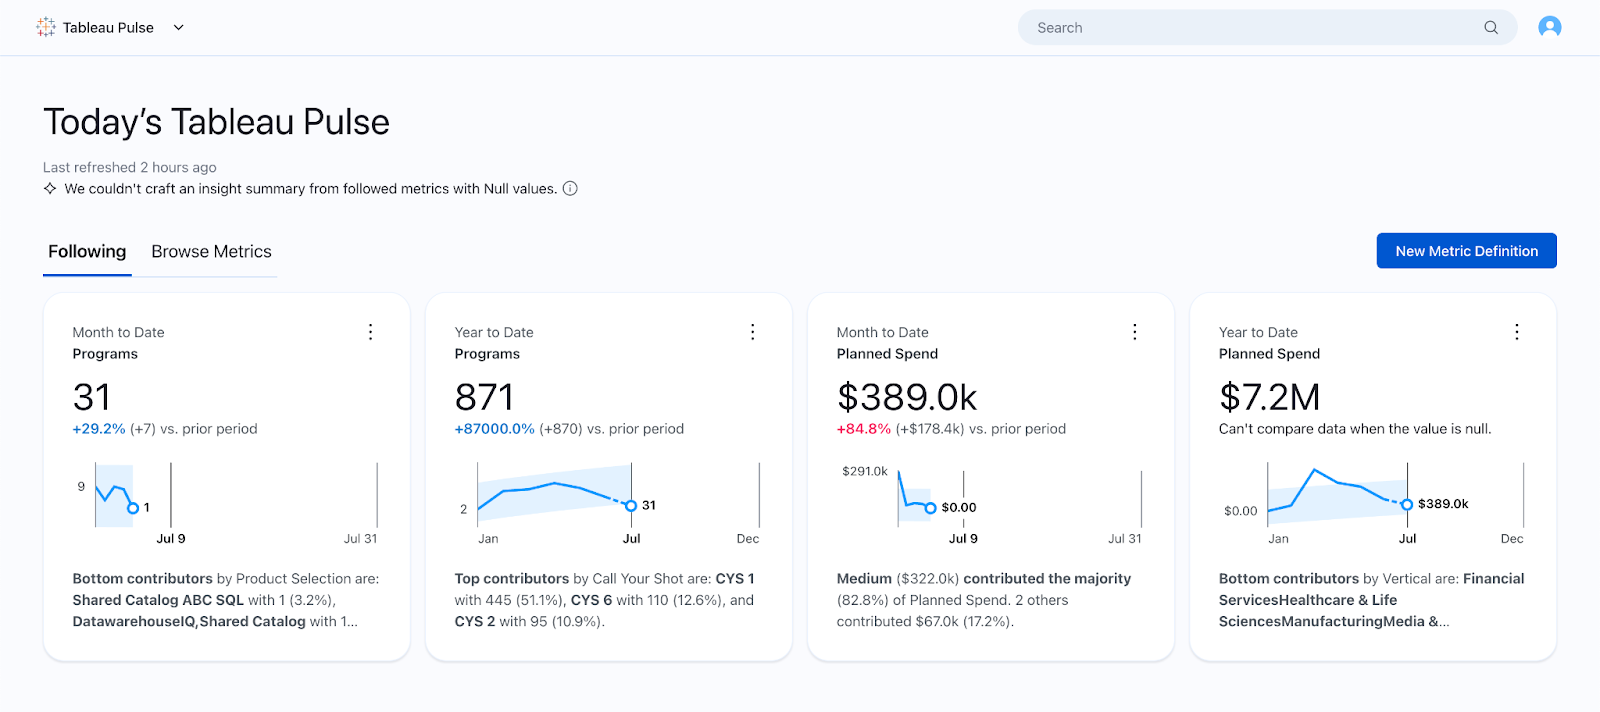
Personalized Homepage and Data Experience
- Tableau Pulse provides a personalized view of each user’s most important metrics and data, ensuring they see only the most relevant information in a simple, easy-to-read format.
- Generative AI-powered insight summaries help users focus on the data headlines, ensuring that important patterns, trends, outliers, and changes in the data are noticed.
- Focusing on key performance indicators (KPIs) tailored to suit your needs saves time and reduces the clutter of unnecessary data.
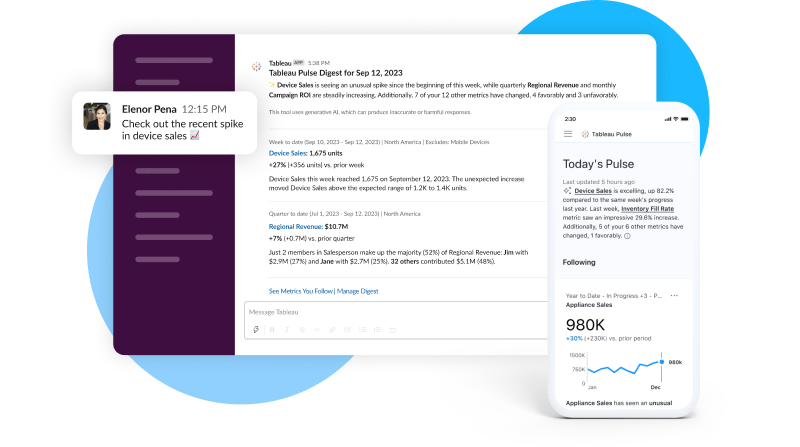
Real-Time Updates:
- Users receive real-time updates on critical metrics in their emails and Slack, enabling them to make timely and informed decisions based on daily data updates/changes in the backend table.
- Instant notifications and alerts about important changes, trends, and anomalies in the data relevant to their specific roles or interests to quickly address any issues or capitalize on opportunities as they arise. Think of it as a news feed on social media, but it is for your business data. You only see what’s relevant to you.
Easy Customization:
- You can set up Tableau Pulse to show the metrics and information you care about the most.
AI-Powered Recommendations:
- Tableau Pulse leverages the power of Tableau AI to deliver data in more personalized, contextual, and smart ways.
- It allows users to interact with their data using Natural Language queries. This makes it easier for non-technical users to ask questions and get answers without understanding complex data queries or visualization techniques.
- Over time, Tableau Pulse learns your preferences and highlights the most relevant insights and trends.
Custom Alerts and Notifications:
- Set up alerts for critical metrics. If your email campaign suddenly spikes in engagement or drops in performance, you get instant notifications, allowing you to act quickly.
Credits: Tableau
Unveiling the Magic: How Tableau Pulse Transforms Your Data Experience
Tableau Pulse offers a reimagined data experience, making data accessible to all users, regardless of their expertise, through advanced visualization tools. Available to Tableau Cloud users, it harnesses Tableau AI to provide data that is more personalized, contextual, and intelligent.
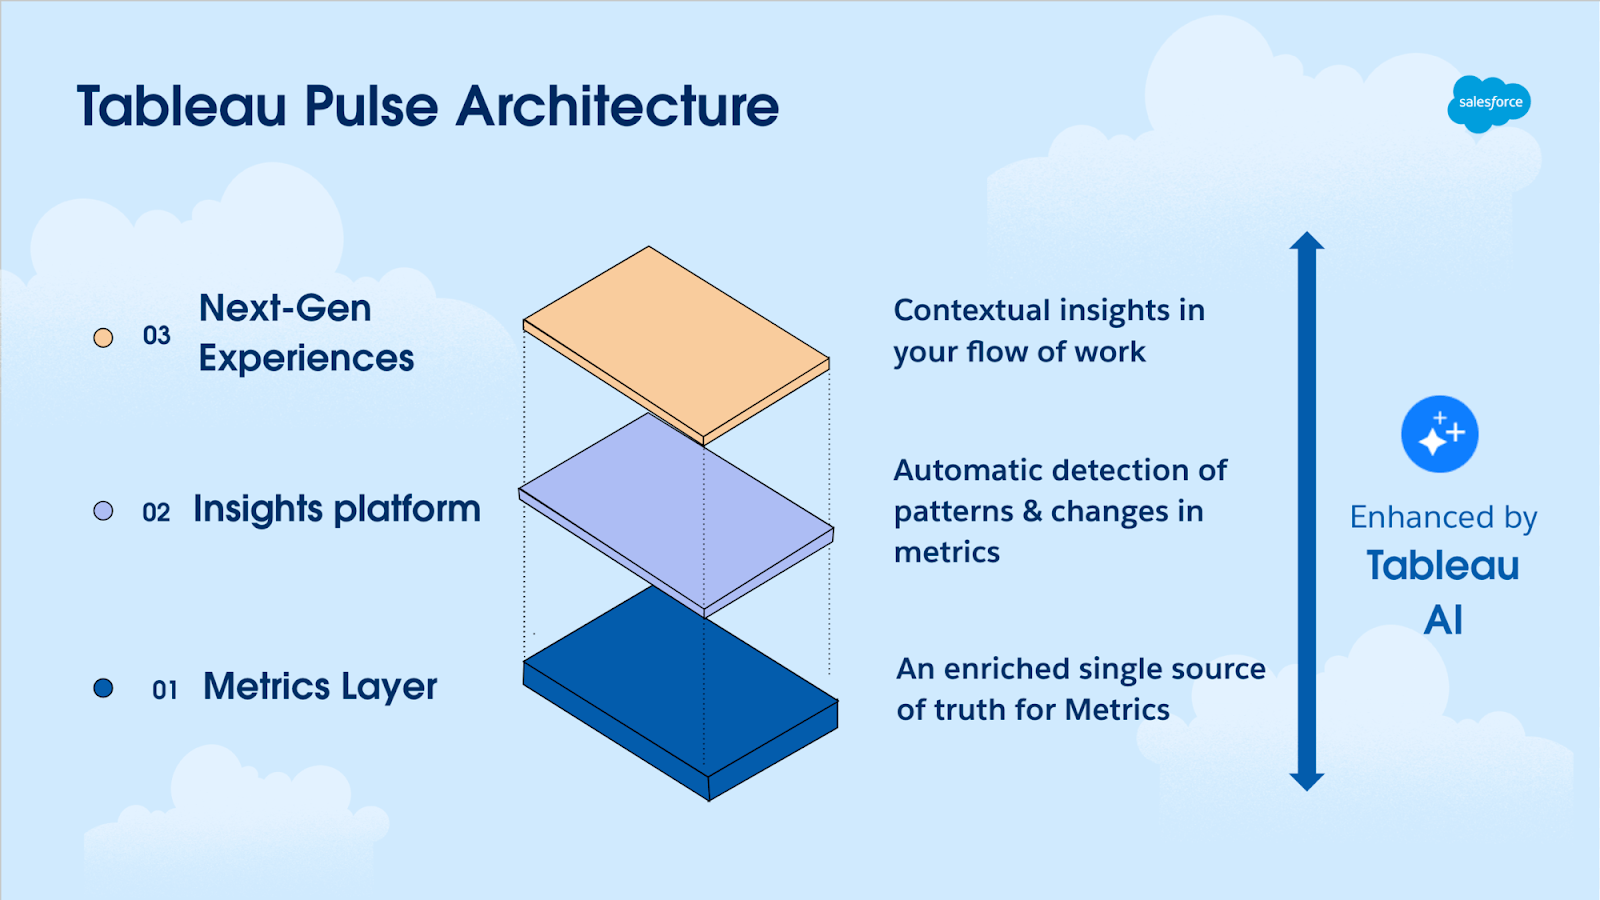
Tableau Pulse introduces a Metrics Layer into Tableau’s ecosystem, enabling a centralized definition of metrics and KPIs accessible across the organization. This streamlines analyst workflows ensures data consistency, and provides a unified source of trusted information.
Utilizing this Metrics Layer, an Insights platform employs statistical analysis to automatically evaluate defined metrics. It prioritizes insights and communicates them using generative AI, simplifying complex data into understandable language. Furthermore, it guides users with tailored questions based on data nuances for deeper exploration.
In addition, Tableau Pulse enhances user engagement with Next-Gen Experiences, integrating data seamlessly into everyday tools like Slack, email, and Tableau’s web application. This approach fosters easy sharing and discovering metrics reminiscent of social media interactions. Powered by GenAI, it distills data into concise summaries highlighting key trends, anomalies, and shifts, ensuring critical information catches the user’s eye.
Mastering Tableau Pulse: Harnessing Data Power Like Never Before
The Insights platform in Tableau Pulse helps users answer basic descriptive questions they have about their metrics, such as:
- How much has a metric value changed since the last period or the same period last year?
- How is a metric performing over time?
- Which dimension members have the greatest impact on a metric value?
- What other dimensions are driving a metric value in a favorable direction?
Insight Types in Tableau Pulse
Tableau Pulse provides a range of insights designed to enhance users’ understanding of their data:
- Period Over Period Change: Displays how a metric has altered between two specified periods.
- Top Contributors: Identifies the highest values within a dimension for a metric over a specified time frame.
- Bottom Contributors: Highlights the lowest values within a dimension for a metric over a specified time frame.
- Concentrated Contribution Alert (Risky Monopoly): Alerts when a small number of dimension members dominate the contribution to a metric.
- Top Drivers: Shows dimension members whose values changed the most in the same direction as the metric.
- Top Detractors: Highlights dimension members whose values changed the most in the opposite direction to the metric.
- Unusual Change: Indicates when a metric’s value for a given period significantly deviates from expected historical ranges.
- Current Trends: Communicates the rate, direction, and fluctuations of changes in metric values.
- Trend Change Alert: Highlights new trends that significantly differ from the current trend.
These insights help users identify patterns, anomalies, and trends within their data, enabling informed decision-making and strategic actions.
Wrapping Up: Empowering Smarter Decisions with Actionable Insights
As we conclude our deep dive into Tableau Pulse, it’s clear that this tool is a game-changer for anyone looking to harness the full potential of their data. By providing real-time insights, customizable alerts, seamless integration with Tableau dashboards, and its amalgamation with Tableau AI, this tool empowers users to stay ahead of critical business metrics and confidently make informed decisions.
With Tableau Pulse, the power of data is at your fingertips, making it easier than ever to turn insights into action.
Stay tuned for our next post, where we’ll explore the real-world use case of Tableau Pulse across Marketing, showcasing how this powerful tool transforms and unlocks new opportunities.


