In our last blog post, we introduced you to Tableau Pulse, a powerful AI-driven analytics feature within Tableau that enhances data analytics by making data more accessible and actionable for users.
Tableau Pulse provides personalized insights into your marketing data, highlighting key trends and anomalies in real time. No more wading through overwhelming amounts of data to get clear, actionable insights tailored to your specific needs. This is the power of Tableau Pulse.
Now that we’ve covered the basics of Tableau Pulse let’s dive into real-world use cases to see how businesses can leverage this tool to drive impactful decisions and improve their operations.
For a business, marketing planning generally involves
- Alignment with OKRs: Set up campaigns that align with your organization’s Objectives and Key Results (OKRs).
- Target Market Segmentation: Define your target market based on region, audience demographics, program size, and expected impact.
- Campaign Types: Plan different campaigns, such as meetups, roundtables, webinars, and newsletters, to effectively reach your target audience.
- Budget Allocation: Distribute your budget across different campaigns to maximize ROI.
Tableau Pulse in Action
Here’s how you can use Tableau Pulse to monitor two main KPIs for marketing planning:
Planned Spend
- Real-Time Updates: Tableau Pulse instantly updates your planned spend, highlighting any discrepancies or overspending.
- Insightful Analysis: The platform offers a detailed analysis of how different segments of your budget perform, allowing for quick adjustments and better financial management.
Number of Programs Executed across various dimensions
- Performance Tracking: Monitor the execution of your planned programs. Tableau Pulse helps you track progress, ensuring all programs are launched on time and meet their objectives.
- Trend Identification: Identify trends in program execution and adjust your strategies to improve efficiency and effectiveness.
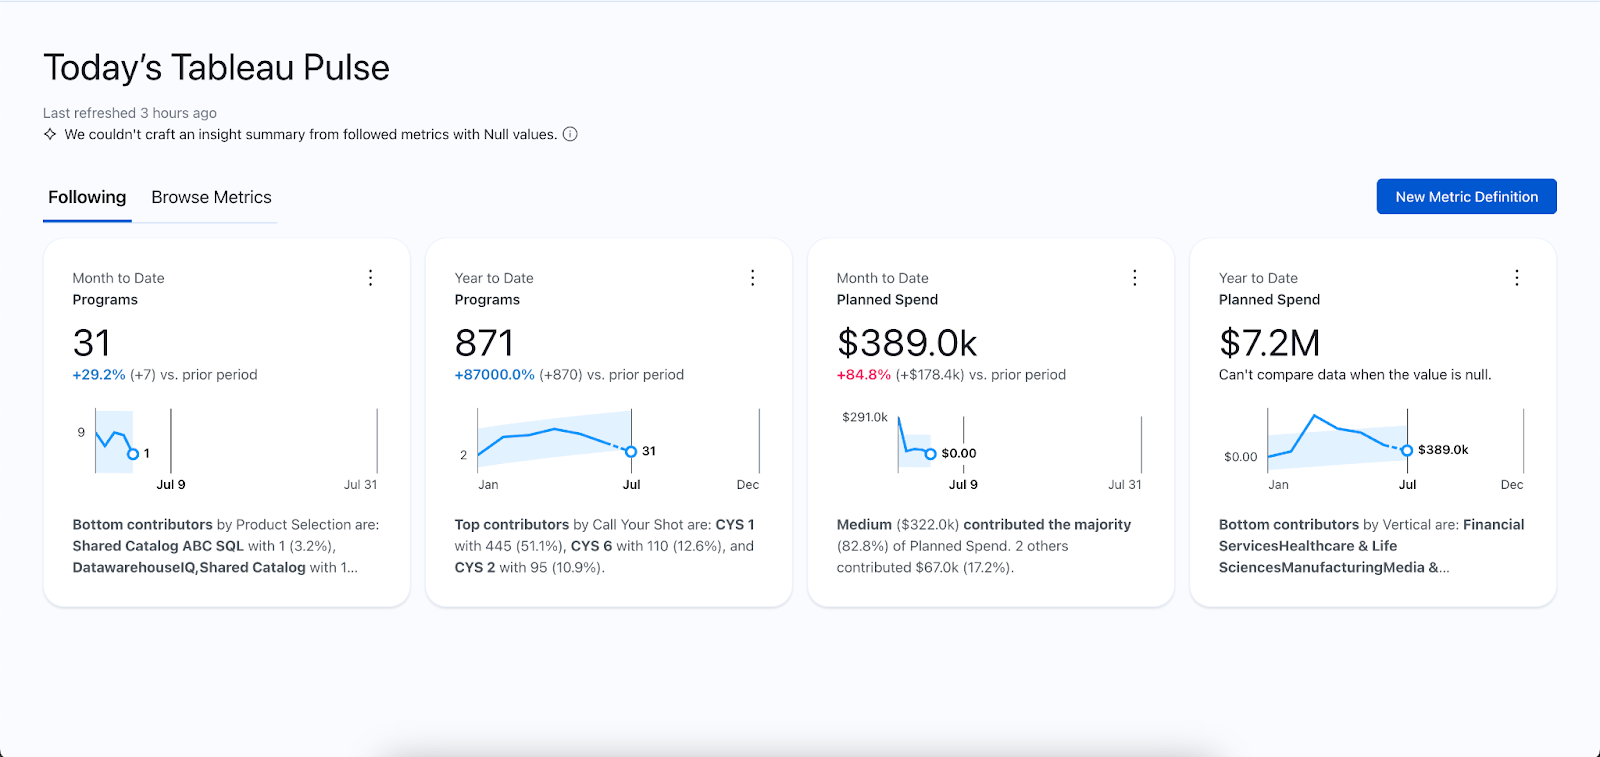
Tableau Pulse Home Page Overview
When you first open Tableau Pulse, you are greeted with a user-friendly homepage that provides a comprehensive overview of your key metrics. Here’s what you can expect:
- Personalized Dashboard: Tailored to show the most relevant KPIs and insights for your marketing planning.
- Interactive Visuals: Engaging charts and graphs that make it easy to understand your data at a glance.
- Real-Time Notifications: One-liners about significant changes or trends in your data, ensuring you never miss a critical insight.
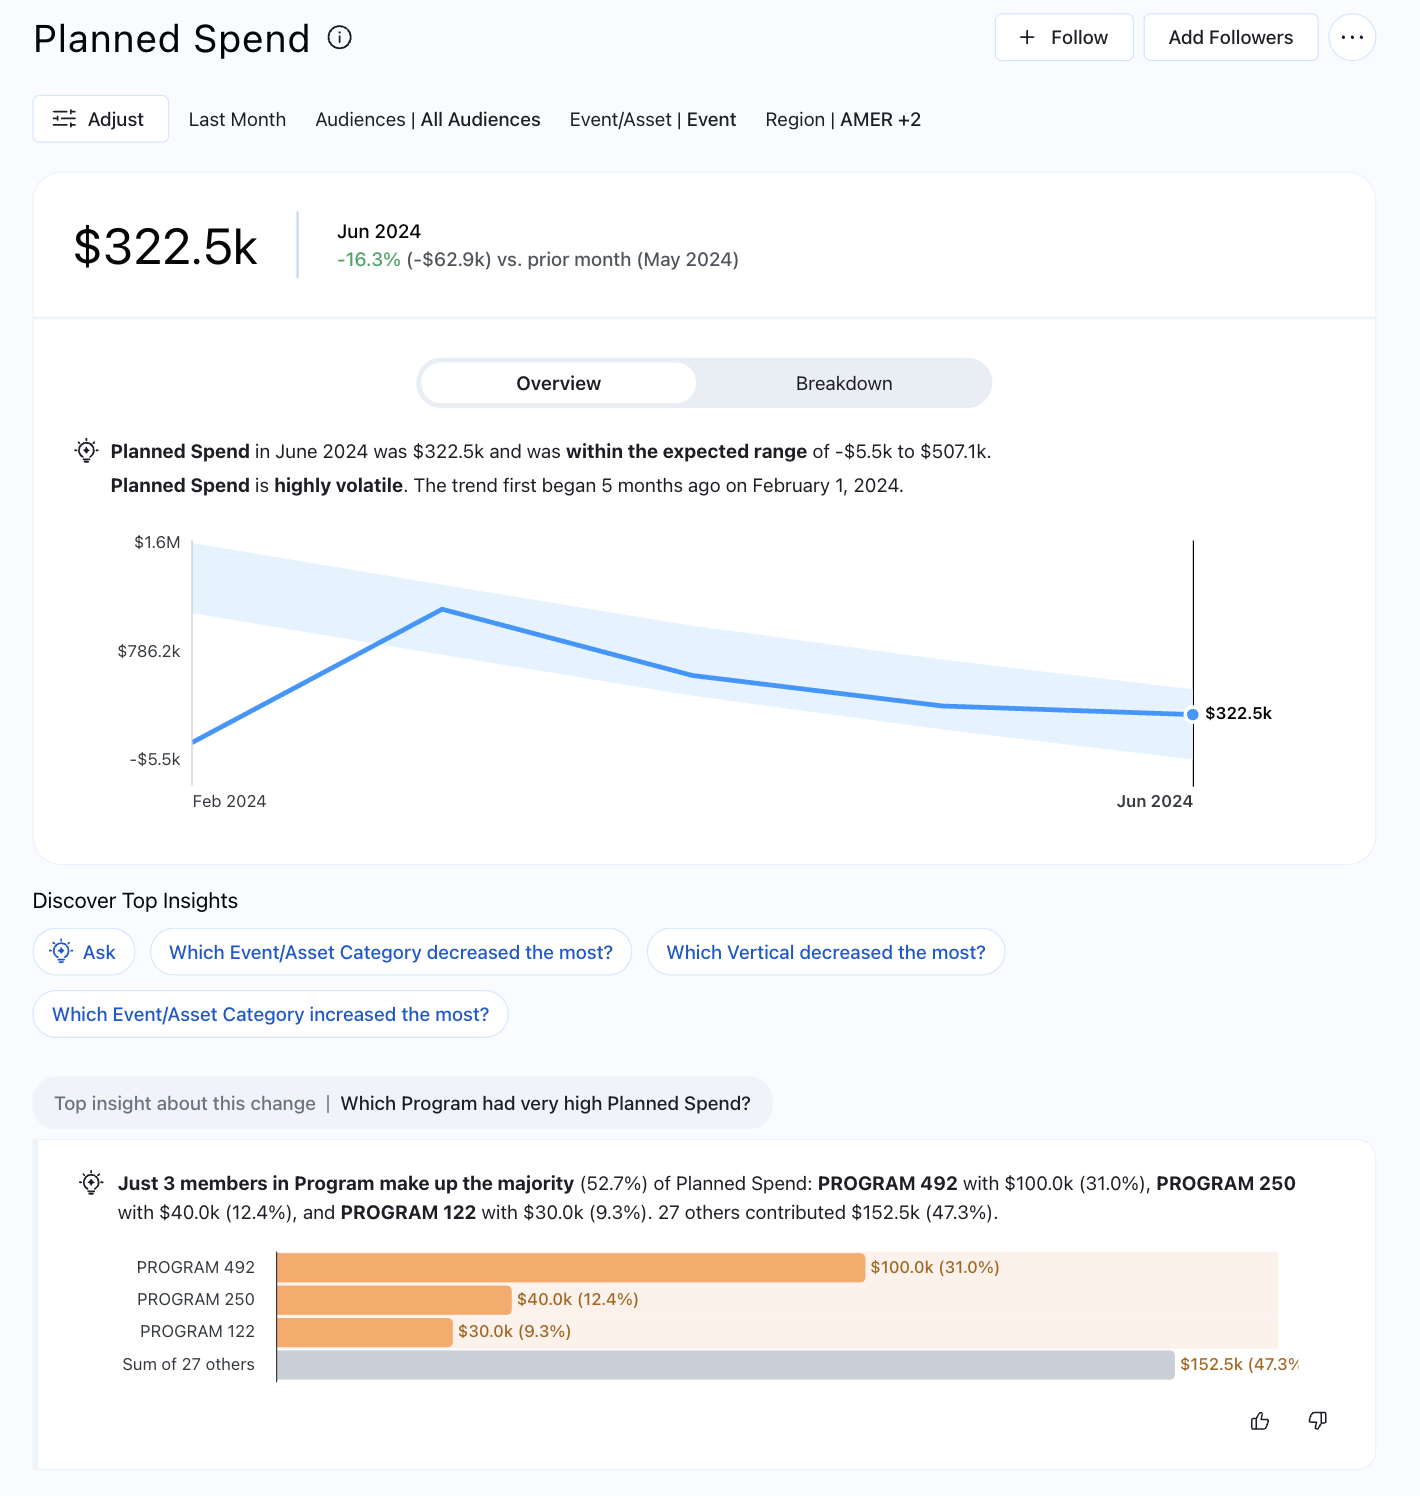
Clicking on any Metric Card drills down into the exploration page, which shows an overview of the metric. The line chart on the Overview tab shows the performance of your metrics, including their trend direction. You can view the metric’s value at different times by hovering over various points on the chart.

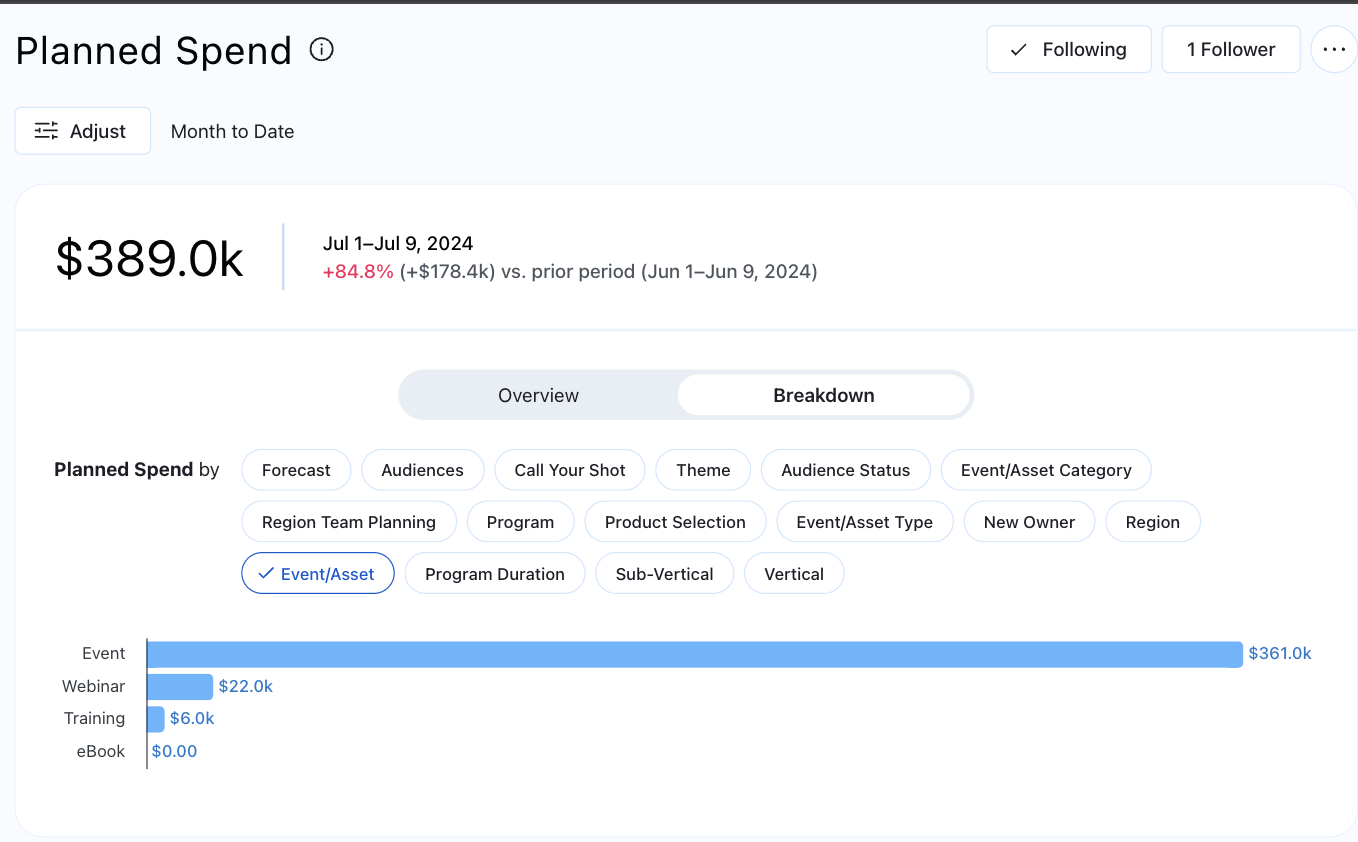
In the Breakdown tab, you can see how different values in your metric contribute to the total value. You can also see your metric broken down dimension-wise, such as by Campaign Type, Owner, or Audience.

Should you require additional insights, you can ask Tableau AI by clicking on the available questions or the Ask button to the left of these questions.
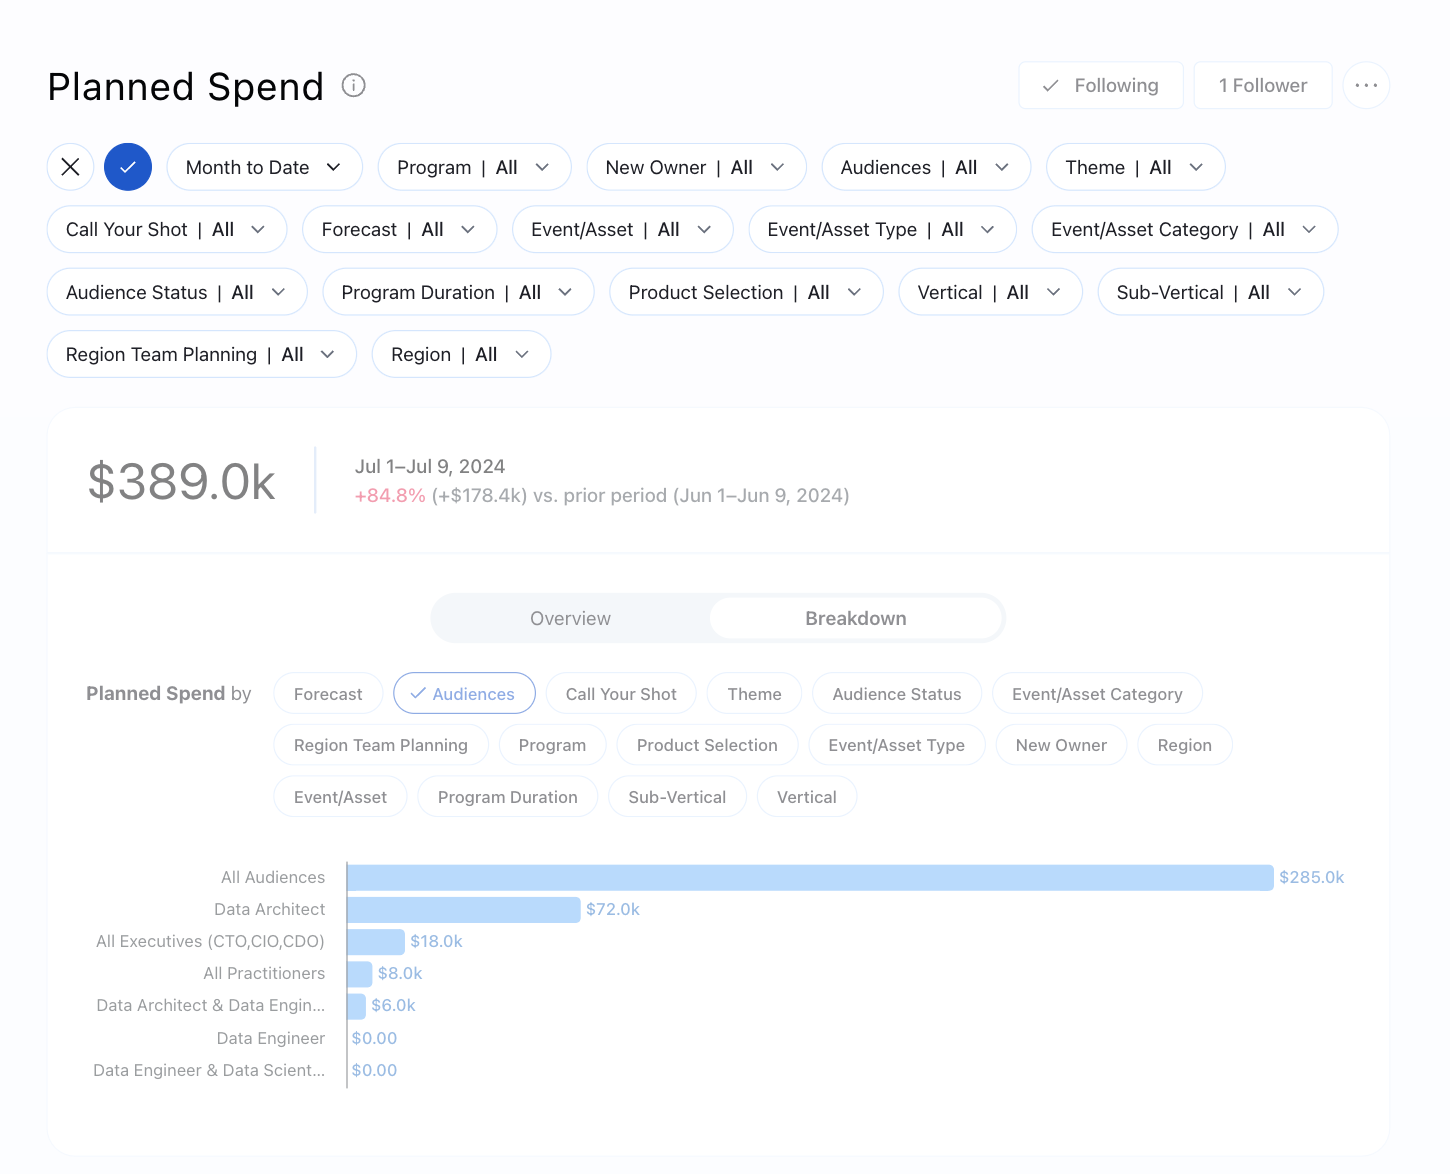
Change the period being analyzed by choosing Adjust. To get insights tailored to your needs, you can also adjust the filtered value applied to the metrics.
After the setup, you can follow the newly created metric to get real-time updates on a specified frequency via email or Slack.
Wrapping Up: It is Time to Turn Data Into Your Most Powerful Ally
Organizations can navigate complex data landscapes confidently and clearly by leveraging state-of-the-art technology to deliver timely, actionable insights. Whether optimizing operational efficiency, uncovering hidden opportunities, or enhancing strategic decision-making, Tableau Pulse stands at the forefront of transforming data into valuable intelligence. Embrace the future of AI-driven analytics with Tableau Pulse and unlock the potential to drive innovation and achieve transformative results in your business endeavors.