

Introduction
The Covid-19 outbreak has disrupted a lot of business globally, and the advertisement industry is not an exception. Advertisement companies serving clients in Travel and Hospitality, Outdoor entertainment, and sports are severely affected due to shelter in place and social distancing restrictions placed by Governments. Since such clients see a decline in business, they are cutting back on the marketing spends, but the key question they would like to answer is how does cutting back on marketing spends will affect the sales? Will, it only affect the sales in the period when marketing spend is low, or the effect will be prolonged? How to compensate for the loss of sales by increasing the marketing spend in the latter half of the year?
This blog explains how predictive analytics can be used to answer the above questions. The blog has the following five sections.
- What is the size of the Global Advertising Market and the key markets?
- Digital Advertising market in the US: Buyer and Seller
- Effect of Covid-19 on digital marketing spend in the US
- Measuring the effect of advertising spend on sales
- Answering the key marketing questions through a simple simulator tool
Market Size and Key Markets
Global advertising spend in 2020 was expected to be around $712B, around 53% is spent on digital advertising. The Digital advertising spend is expected to grow at ~15% from the year 2019, and total digital advertising spent is expected to be around $385B. The below graph gives the expected growth rate and contribution of digital advertising that will be spent in the upcoming years.
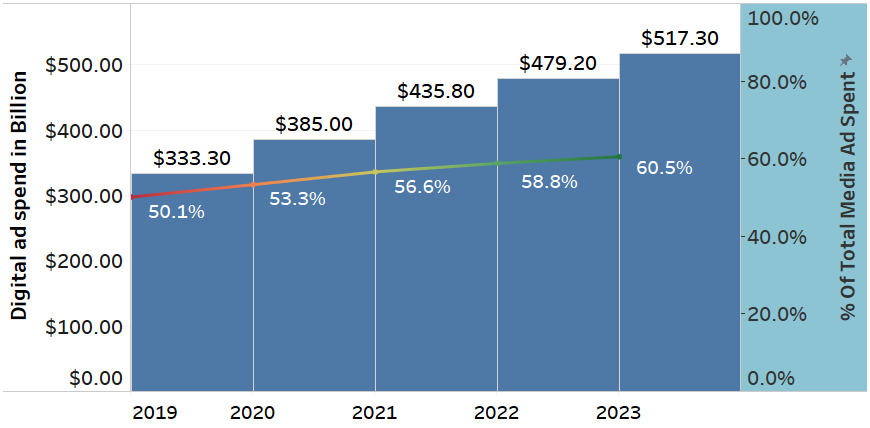
Source: Emarketers
Television advertising is the most popular choice for advertisers among traditional media spend. The growth in the spend in this category has remained flat over the last few years. But overall, it contributes roughly around ~29% to the global advertising spent.
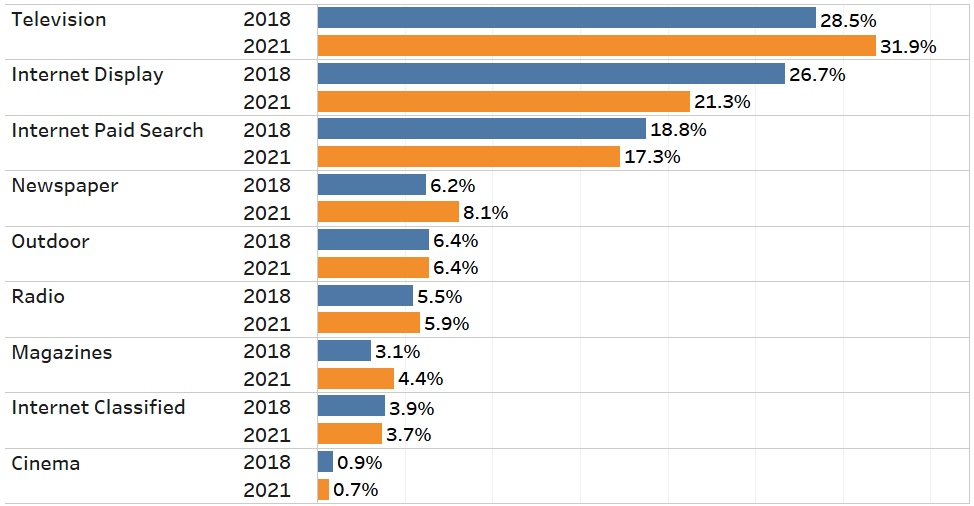
Source: Emarketers
The US and China are the two largest advertising spenders. Together they account for 63% of the global Advertising spent as well as Digital Advertising spent.
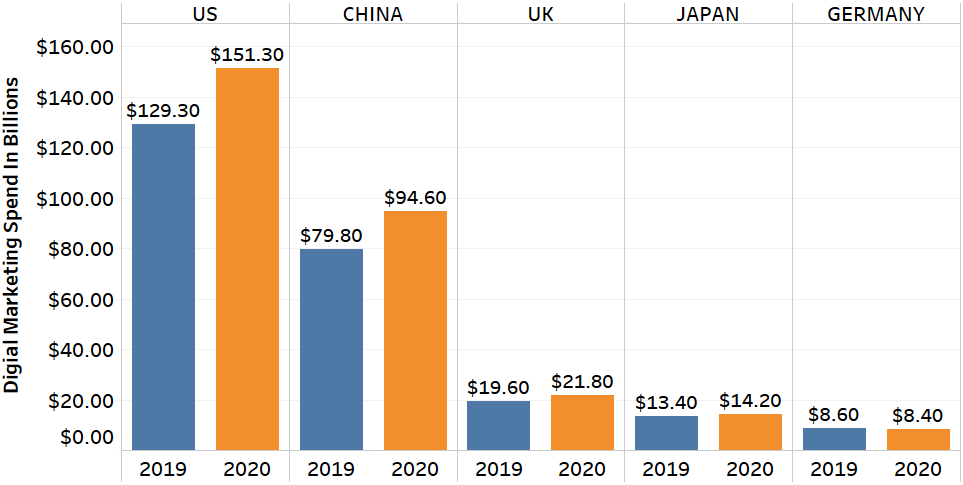
Source: Emarketers
Digital Advertising Market in the US – Buyers and Seller
Total Digital Advertising Spend in the US is expected to be $151B. It is around ~53% of total media spend. Retail, Automotive, and Financial services are the top 3 sectors which contribute to ~46% of the total advertisement spent in the US.
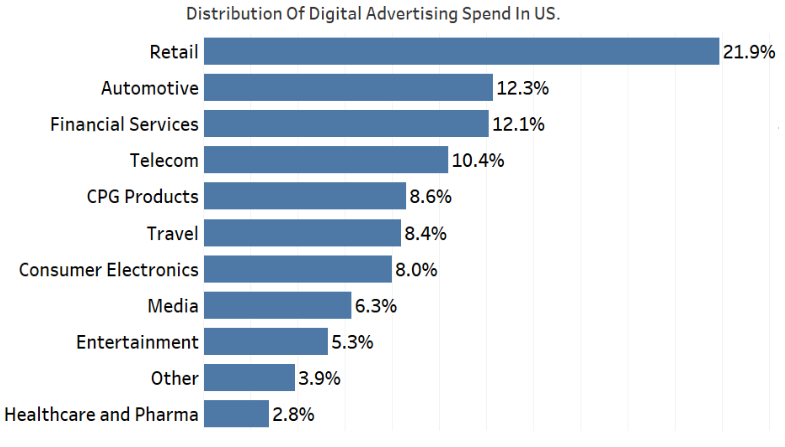
Source: Stastica
Google and Facebook are the top 2 players who provide platforms, tools, and services to facilitate digital marketing campaigns. Together they account for 60% of the total digital advertising in the US.
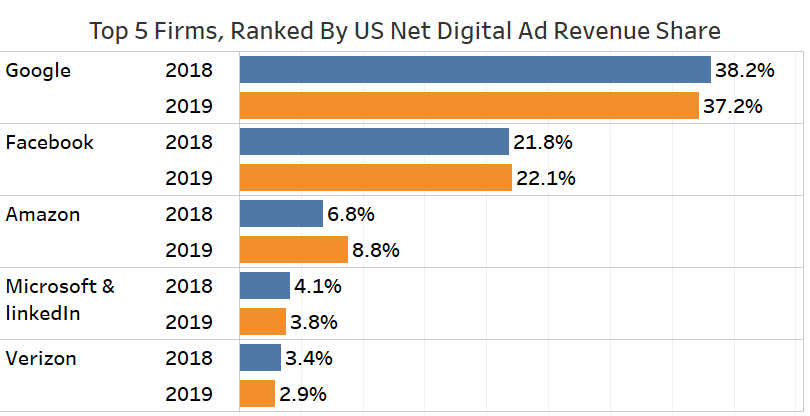
Source: Emarketers
Effect of Covid-19 on media spend in the US
Due to Covid-19, Global Advertising spend is expected to reduce by $98B worldwide. From pre COVID expectation of $712B, it is now expected to be at $614B as of June-20. From a pre COVID-19 growth estimates of 7% growth as compared to the previous year, it has rather declined by 4.9% as compared to the previous year.
The US is the worst affected country due to Covid-19. Some of the major cities in the US have gone for the lockdown to prevent the rapid spread of the virus. Most of the companies have provided the option of Work from home. Since people are not going out and commuting to work this will likely affect the advertisement spend on certain mediums like Outdoor and Radio whose combined Advertising spend is $31B in the US. Some of the sectors like Retail, Media, and Healthcare are observing an increase in demand for their product and services. This can be witnessed through the improvement in traffic and conversion metrics observed by most of the firms in these sectors.

Source: Neil Patel Blog
Traffic growth in sectors like Media and Entertainment has increased by up to 30% for some of the firms. Similarly, the demand for essential products and services in the Food and Healthcare sector has also increased.
Source: Neil Patel Blog
Measuring the effect of advertisement spend on Sales
Traffic growth and conversion had badly affected most of the companies in the Travel, Transportation, construction, Real estate, and Manufacturing sectors. Due to a decrease in business activities due to lockdown, companies in these sectors will cut on the advertisement spend.
To measure the effect of reduction in Advertising spends on Sales, mathematical models can be built, which will effectively tell how advertisements affect sales. Using such models, companies can see the effect of going dark in one or two-quarters of sales. It can also simulate how much additional Advertising spend they need to do to reach their yearly target sales level.
Sales can be impacted by various factors. These factors can be broadly categorized into the following categories:
| Category | Variables |
| Baseline | Price, Assortment, Velocity, Distribution |
| Promotion | Sales Promotion |
| Discounts | Coupons |
| Seasonality and Holiday | Seasonality and Holidays |
| Media Activity | Media Spends, Reach, Clicks(Digital) |
| Competition | Media Activities, Discounts |
| Others | Social Media, Google Trends, Cyclicity,Events and Launches |
Based on the above categories of variables, mathematical models can be built to answer some of these questions. The detailed approach note on mathematical models can be referred to in the Marketing Mix Modelling article. The model can provide the factor importance of each category of variable and effect of each variable on Sales.
Answering key Marketing Questions through the simulator
In order to understand the effect of advertising spend on sales, we have built a simulator tool which takes into account the factor importance of advertising spend and its effect on sales.
The following picture depicts the GUI of the tool.
The GUI has three section
- Input Section – Users can select the quarter to go dark and a quarter to simulate sales in this section.
- Simulation Section – This section will simulate the result based on the scenario selected by users.
- Results Section – This section shows the results of scenarios selected by users on sales and advertising spend.
The simulator needs the following inputs:
- The mathematical model providing factor importance of independent variables
- At Least 1 year of weekly historical data on the significant variables used in the model
Based on the mathematical model which was built, the following variables were significant.
- Advertisement spend
- Discount rate
- Competitors Impact – % of the audience of the total surveyed who are willing to buy competition product
- Consideration – % of the audience of the total surveyed audience who are considering buying the product
- Events and Conference – Google search volume for the concerned Events & Conferences
- Empowers me to achieve – % of the audience of the total surveyed who think the product is empowering them
Based on the factor importance of the significant variables, an excel based simulator tool can be created to easily visualize the effect of advertising spend on sales. The below section demonstrates the two scenarios.
Scenarios
Scenario 1: What is the effect of going dark for 1 quarter on the unit sales?
This effect can be tracked by clicking on the “Going Dark” button on the simulator section of the tool. It will set the spending for that quarter as 0. Based on the effect of advertisement spends on unit sales from the mathematical model, it will update the unit sales for this quarter as well as the upcoming quarter. This is illustrated below.
Step 1: Select the Quarter to Go Dark in the Input section and press Go Dark Button on the simulator section of the tool.

Step 2: The effect of going dark on sales can be seen in the result section of the tool in FY20Q1 and FY20Q2.
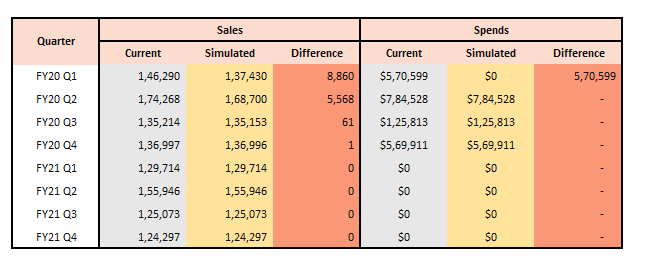
It can be seen that Sales in FY20 Q1 have changed by 8860 units and FY20 Q2 has changed by 5568 units. Additionally, there is a minor impact on FY 20 Q3 and FY 20 Q4 as well.
Scenario 2: How much additional advertising spend should be made to reach the targeted sales level?
Due to going dark, my sales got reduced by 14.4K units. Let’s say we want to compensate for this reduction in sales by increasing the advertising spend in the upcoming two quarters.
Step 1: Select Quarter to stimulate sales in the Input section of the tool as FY 20 Q2 and FY 20 Q3

The combined sales for FY 20 Q2 and FY 20 Q3 with the effect of going dark in FY 20 Q1 is 303853 units.
Step 2: Set the solver target to be how much additional sales is required. Ideally, we would like to compensate for the entire 14.4k loss in sales, which occurred due to going dark. Hence we will set the target of 318K and press the simulate button in the simulation section of the tool.
Please note that the planned budget spent on the FY20 Q2 and FY20 Q3 was $910K. Once the simulation is complete, we can see that maximum possible sales, which is possible, is 316K units that are around 2k short of our desired target.
To achieve 316K units of sales, we will need to spend $1.5M
Thus additional advertising spends of $660K will lead to an additional 12.2K units of sales thus minimizing the impact of going dark from 14.4K unit reduction of sales to just under 2k reduction of sales.
Conclusion
Even though Covid-19 is causing the reduction in sales and hence marketers are pausing the planned marketing spend for a certain period, It is possible to understand the effect of pausing marketing spend for a certain period on sales. Based on the shortfall observed, planned spend for the upcoming period can accordingly be tweaked to reach closer to the desired targeted sales level, thus minimizing the shock caused by the Covid-19.


